Wednesday, March 5, 2008
bob


The Integral BOB
BOB ^ 8
Anyways, this unit, applications of integrals, was definitely not a cake walk. I think there's quite a bit of material left for me to review, mostly due to the fact that I seem to be lost in a haze since we only have class every second day now and I'm usually too busy with other things to finish all of the homework. But all in all, a lot of the applications of integrals we have covered during this unit are quite similar. Such as the similarity between evaluating the volumes of various solids revolved about the x or y-axis or a particular line like y = -1 and using density functions and such to find a mass or population (the last section of this unit).
Since I mentioned the last section of this unit anyway, I think that's probably the only place where I might run into some trouble on the test tomorrow. The main reason for this is because the process of solving such problems aren't straight forward in the least, though once you repeat the logic undertaken each time you attempt a problem of this sort (where unit analysis incredibly simplifies the matter) the approach for each question becomes more apparent each time.
Besides the aforementioned troublesome questions, I don't think that there is anything else I might find excruciatingly difficult on the test. The only things we really have to know for tomorrow are:
- The difference between displacement and distance when integrating a velocity/speed function.
- Determining definite integrals to represent the volume of a solid, and evaluating Riemann sums and these self-generated definite integrals.
- How to use integrals to determine the average value of a function. (Just think of finding the average normally, ex. adding up all your marks (an integral) over the total amount of marks (the size of the interval)).
- How to use integrals for differing scenarios, such as oil density or population density of cities. I suggest reviewing chapter 8.5 in the textbook for elaboration and some practice on this topic.
Well that's it, I haven't completed such a long BOB in quite a while. Well, I hope everyone does great on the test tomorrow, don't forget to go over all your notes and practice some problems tonight. Study hard everyone! I know I will.
I wish everyone good luck on tomorrow's test and a good night!
Pre-Test blog (Gearing Up)


Tuesday, March 4, 2008
BoB!
There are still a couple of things that I'm worried about. However I can't seem to place it. It's just that feeling in the gut. Hopefully some more practice will clear out any doubts.
Confidence may be my only hope! Good luck to everyone else on the test :)

Monday, March 3, 2008
Craig's BOB
As well, it gave a bit more practice for solving integrals a bit quicker and allowed us to use a lot of previous techniques/skills to do them.
I would have to say that the hardest part of the unit was the last bit with the radial density because of how much translation from real circumstances to mathematical equations and diagrams. However, once again as soon as it was translated, it became quite easy to solve.
So after the pre-test, we will see what kinds of questions to expect on the test, and what areas we need to brush up on a bit.
See you all tomorrow and good luck on the pre-test and test!
Friday, February 29, 2008
Wednesday, February 27, 2008
Boston By The Sea
Now, I know we didn't really cover a lot of material today but were presented with a rather new type of problem and also a quick quiz at the beginning of class. For the problem, we have in fact encountered somewhat similar problems, such as the oil slick problem, but the main difference is that we are now dealing with a numeric representation of the density function, rather than a symbolic one. Remember that on the exam, we could be given a varied amount of different representations, ideally numeric, symbolic and graphical ones. So try to practice not only questions that convey a specified density function in the question, but also practice those that have a numerical representation (say a table of values such as today's question) or an accompanying graph. I believe that this idea was the basis of today's problem and overall lesson.
Before I continue onward with the detailed progression of today's problem, I'll first digress and explain the quiz that preceded the challenging question. Though we went over the answers to the quiz afterwards, we did not detail each questions solutions. I felt obligated (not entirely sure why =p) to do so now for each question.
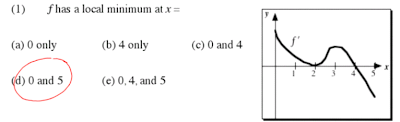
Knowing the behaviour of the derivative of a function and it's relation to the parent function helps incredibly in this analysis. You must know that not all roots of f' are maximums or minimums, such at x = 2. This is because since there is no sign change, what happens at x = 2 is that there exists a plateau or flat portion in the parent function, thus the horizontal slope at x = 2. Also, looking at x = 4 as another candidate for a local minimum or maximum yields a sign change from positive to negative. This change indicates that x = 4 yields a maximum on the parent function, because since f' is positive to the left of x = 4 and negative to the right of x = 4 the parent function is increasing until it hits x = 4 then turns downwards, therefore it is a local maximum. Now there's only one thing left to analyze since the zero's are now out of the question.
Don't forget about the endpoints of the function. At the endpoints of f', since f is increasing on (0, 4) and then f starts to decrease once again on (4, 5), they turn out to be LOCAL minima on the parent function. This is because since the function start out low at x = 0 and then increases from that point on until x = 4, it is a local minimum. After the function reaches x = 4, the function begins to decrease and therefore reaches another low point at the end of the function. Don't confuse the question with finding the global minimum, which is actually the mistake that I made when I chose my answer. You must recognize that local minima are only considered minima on a small interval central to that point, not over the entire function. Thus both endpoints qualify as LOCAL minima.

We basically are now looking for the zero's of f'', which occur at the local maxima and minima of f'. We can quickly see that there is a maximum present at x = 3 and a minimum at x =2, therefore these are also the points of inflection of f. Don't forget, however, to analyze the shape of these points to determine whether they are in fact points of inflection or not.
Answer: There are points of inflection at x = 2 and x = 3.

In this question, the level of comprehension required for this question does not really bypass the simple rules of antidifferentiating polynomial functions and knowing the connection between acceleration, velocity, and position. This required connection involves the fundamental theorem of calculus, which implicates the process of integration as the reverse of differentiation. Knowing this, and seeing that velocity is defined as a change in position over a given time interval, it can also be perceived as the time derivative of position, which is also followed by the relationship between acceleration and velocity. This indicates that antidifferentiating the acceleration function given gives us the velocity function. But don't forget that the arbitrary constant of integration, C, must be determined using the fact that v(0) = 1. Using this, we can easily solve for C by substituting 0 in for t and setting this equal to 1. Now, since velocity and position are also related similarly, we can antidifferentiate this new velocity function to determine the position function. Don't forget once again, however, to use the fact that s(0) = 3 in order to determine the constants value and finish off the final function.
Answer: s(t) = t3 + t + 3
Question #4:
 This question is a truly interesting one, and also sparked a discussion as Mr. K was pulling up the answers to the quiz. It was really just a discussion concerning the negative sign of the cos(x) function, though this quarrel was quickly settled as Mr. K began detailing the solution to the problem. Now on with a reiteration of Mr. K's solution, though I will tend to elaborate wherever I can.
Since we're finding the area under two separate function on the interval x = 0 to x = k, we know that we're going to be finding the value of two separate integrals with the intervals lower and upper limits. Also, just looking at these functions yields should yield a sigh of relief since these functions aren't complicated at all to antidifferentiate each function, so it would be quite easy to continue on that path now. First, as it shows in Mr. K's work, we must set these two integrals equal to each other on the same interval, 0 to k. Then, all you must do is antidifferentiate each function, giving you an equality as shown in the first line in black print in Mr. K's solution above. Don't forget that the antiderivative of sin(x) is -cos(x) and not just cos(x). Remember this is so because the derivative of cos(x) is -sin(x), so just sin(x) is just missing that negative sign when going backwards. Also, don't neglect substituting the 0 into the trigonometric function -cos(x) when integrating the left side, since cos(0) yields a 1. Watch the negative signs though, and try not to get mixed up by the negatives in the function.
Now once you have determined the final equality after antidifferentiating and inserting k and 0, you could solve this in two different ways. You could either leave the two functions equal to each other, and find points of intersection between the two graphs. Or you could find move everything to one side and find the zero's of the function. Either way, it'll require the use of your calculator but yet still yield the same answer.
Answer: 1.300
____________________________________________________________
And now, on to the problem for today's class, the Boston By The Sea" problem. First off, Mr. K quickly told us the origin of Boston as a harbour that slowly grew outwards into the ever-growing city it is now. He really only mentioned that since the question modeled the city using a semi-circle. Here is the question.
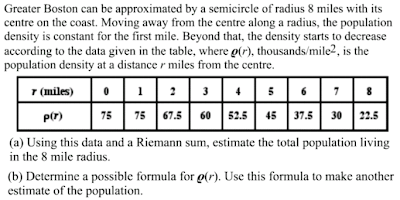
In class, we were only able to cover question (a), though our solution never came to fruition and is therefore homework for Friday's class. Now on to our discussion concerning the first portion of this question.
Now you must first identify what your first task is while approaching this question. If you analyze the question thoroughly, as you should do for long answer questions similar to this, you should notice that the density function gives a value in units of population (in thousands)/miles2.
You now must be able to try and find a way to multiply the thousands of people by a unit that will reduce with the miles2 to only give the answer a final unit of population (in thousands of people). This can be done by multiplying the density function by the areas of various semi-circles with varying radii. All of our work on this problem can be seen on the following slide
 The function in the top left of the above slide depicts the integral Craig proposed to solve the problem part (a). Through much discussion, however, it was decided that this integral would not work for one main reason. The reason is that if we were to use this integral, we would be finding the area of successive semi-circles with changing radii, the further out you go from the center, the larger radii, but this poses a problem because each following area will include the area of the previous semi-circle, meaning you'd be adding the area of each semi-circle several times using this integral. Now we're also going to have to use only the interval given in the data, to find a Riemann sum, but we can only use the intervals of. Therefore, estimating the area underneath the curve (which is the integral we're looking for) would require us to know the values between 0 and 1, 1 and 2, 2 and 3, etc.,but we don't know these values so we can't use left and right-hand sums unless we only use the given data.
Now, follow the yellow section of the figure to the left, and the yellow highlighted function just to the right of the figure as they correspond to each other. Looking at the data, we can see that there is no change in density in the very first semi-circle of radius 1. Thus, we can create a simple expression to show the amount of people in this section by multiplying the density function by the area of this semi-circle. This very expression is what is highlighted in yellow.
But now we must try and model the rest of the semi-circles, and we can do this by breaking each semi-circle into rings between each circumference. One of these rings is represented by the green section in the diagram. This ring can be taken out and straightened out to then be represented by a rectangle, which is also shown by the green highlighted section. The length of this rectangle will be equivalent to the circumference of the semi-circle, and will have a width equivalent to the change in the radius, which is consistently one in this case. Therefore, we now have a model to determine the actual amount of people in the entire section between r = 0 and r = 8. Adding the successive parts of each interval to the expression highlighted in yellow will yield us our final answer for part (a).
Now, our homework for today's class was to finish up this problem and calculate the amount of people in the 8 mile radius. Don't forget to complete your homework for Friday's class everyone.
I think that's all for my scribe post today. As I mentioned in the beginning of my scribe post, the scribe for tomorrow's class will be ETHAN, that is unless he can't make it to class again, in which case the scribe will be VAN. Goodnight everyone and have a pleasant tomorrow! ( I can't remember where that's from, but oh well! =D) I hope my scribe post helped anyone who was in seek of some elaboration upon today's class, or was yearning for some explanation on the subject of applications of integrals. Have a good one everyone!
Monday, February 25, 2008
Tuesday, February 19, 2008
Thursday, February 14, 2008
Tuesday, February 12, 2008
Friday, February 8, 2008
Wednesday, February 6, 2008
Monday, February 4, 2008
Thursday, December 20, 2007
Bob VI
Tuesday, December 18, 2007
SCRiBE
Slide 2:
1.a) - we filled in the chart by calculating the integrals (signed areas) under the graph, start from in this case, -2 because the integral is from -2 to x.
1.b) - we sketched the graph simply by plotting the points we gathered from our table in question a.
1.c) - we analyzed the graph for local extrema
- the only critical number is x=2 because at that value of x, a local minimum is present
- end points are not critical numbers because there is no way of distinguishing if it is a local maximum or minimum without checking the slope on both sides of the point
1.d) -we simply found where the graph was increasing by looking for a positive slope
Slide 3:
a, b.) - to obtain these solutions, we can simply replace the variable t with x, included in the domain of the integral, due to the fundamental theorem of calculus
brief description of process:
- F(X) = f(b) - f(a)
- from this we get: (-cos(x^3)) - (-cos(pi))
- now we want to find the derivative of this integral (stated in the quesiton)
- we get: sin(x^3)
- the derivative of a constant is 0
c.) -the solution to this question was similar, however, since the integral is from x to 1, we can make the integral NEGATIVE to make the integral from 1 to x instead
Slide 4:
d.) - the solution is similar to that of question c on slide 2
e, f.) - these questions include a slight different solution
Slide 5:
- to find the amount of gallons using the rate (derivative), we integrate it from 0 to 4 hours
- yes, it's that simple =)
Slide 6:
- the only trick to this question is the +3 included in the integral
- we solve this part by find the integral of 3, from 4 to 7
Slide 7:
- points of intersections are found by making the two functions equal each other
- then, but inputting values between the pair of intersections (-2, 0) & (0, 3) we find which graph is on top of the other, in each case (in this case, twice)
Slide 8:
- we applied: (integral from (-2) - 0) ((top function) - (bottom function)) + (integral from 0 - 3) ((top function) - (bottom function))
- solve algebraically, applying rules of finding the derivative of an integral
- grunttt workkk
THE END
Okay I hope you guys found this slightly helpful. It wasn't as specific as it should be but yeahh. Tomorrow's scribe is.. Etimz since he was the only one who hasn't done his fifth scribe yet.. or something like that.
Good luck on the pre-test tomorrow! bye =)

